About react-native-network-logger
React Native developers seeking to streamline their debugging process for network activity can significantly benefit from the "react-native-network-logger" module. This tool serves as an HTTP traffic monitor specifically designed for React Native applications, providing real-time insights into network requests and responses without the need for additional dependencies. Its capability to capture detailed information about HTTP calls, including status codes, headers, and response times, makes it an invaluable asset for optimizing and troubleshooting network-related issues in mobile apps. This npm package thus enhances the developer's ability to quickly identify and resolve network problems, leading to more robust and reliable applications.
To integrate "react-native-network-logger" into a React Native project, developers can easily add this powerful tool by running the npm install react-native-network-logger command. This simple installation process adds the package to their project, allowing them to begin monitoring network traffic immediately. The logger provides a user-friendly interface that displays a chronological list of all network requests, which can be further examined for detailed analysis. By enabling developers to view and inspect network interactions directly within their applications, it ensures that they can maintain a seamless user experience by swiftly addressing any issues that arise.
The "react-native-network-logger" is particularly advantageous for React Native developers focused on enhancing application performance and security. By providing a clear overview of all HTTP traffic, it helps in identifying inefficient network requests and potential security vulnerabilities. Furthermore, since it operates without any dependencies, it maintains the lightweight nature of projects and simplifies the maintenance process. This npm package not only aids in the immediate identification and rectification of network issues but also contributes to the overall strategic development practices, promoting better performance optimization and security protocols within React Native applications.
Dependencies
Core dependencies of this npm package and its dev dependencies.
undefined@react-native-community/eslint-config, @release-it/conventional-changelog, @testing-library/react-native, @types/jest, @types/react, @types/react-native, eslint, eslint-config-prettier, eslint-plugin-prettier, husky, jest, prettier, react, react-native, react-native-builder-bob, react-test-renderer, release-it, rimraf, typescript
Documentation
A README file for the react-native-network-logger code repository. View Code
react-native-network-logger 
![]()


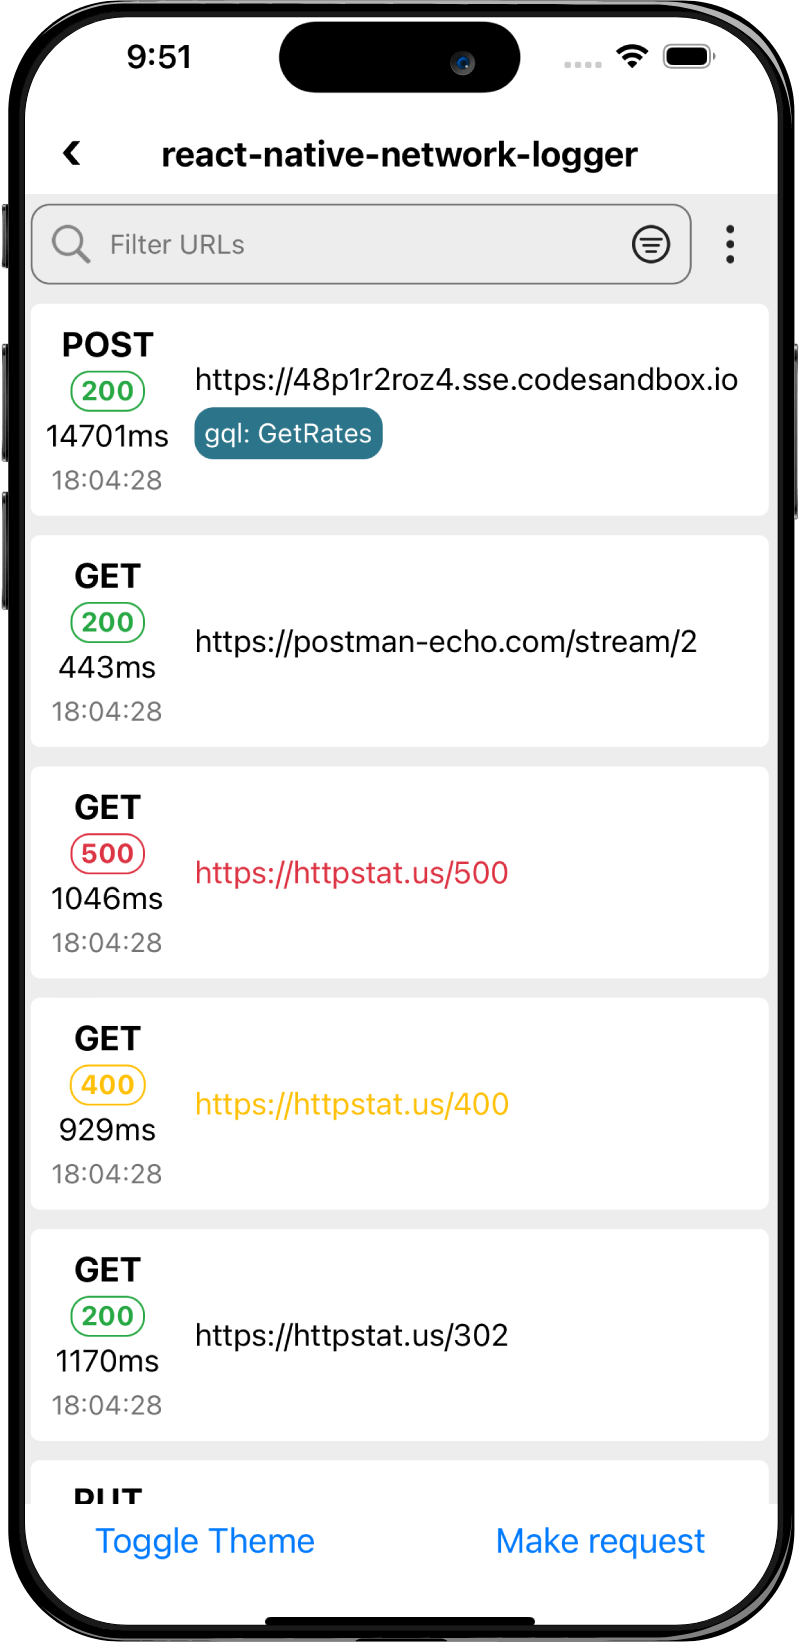
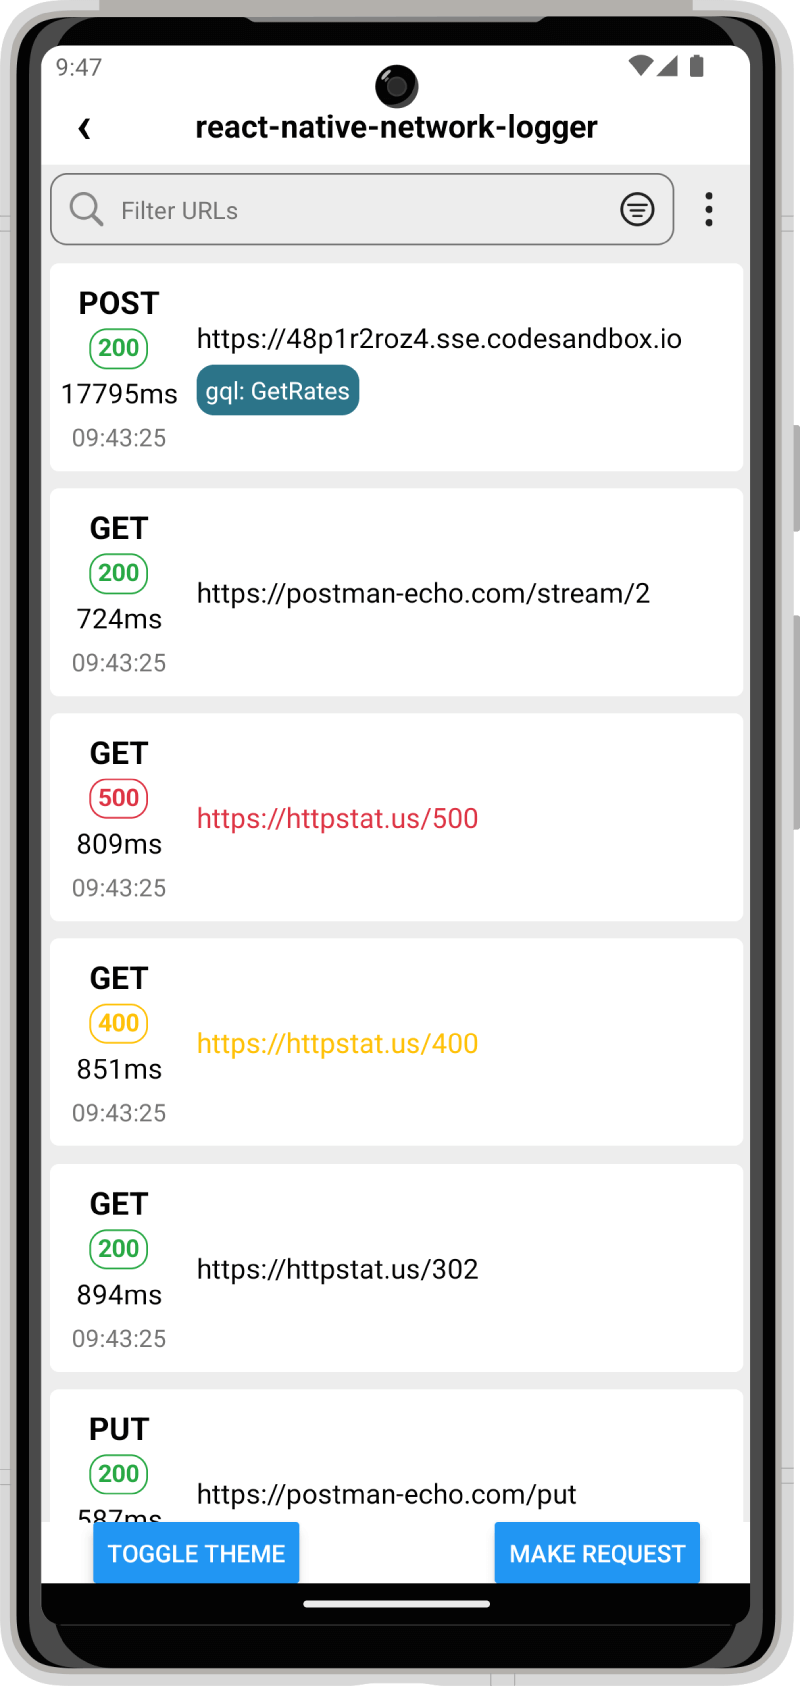
An HTTP traffic monitor for React Native including in app interface.
An alternative to Wormholy but for both iOS and Android and with zero native dependencies.
If this project has helped you out, please support us with a star 🌟.
Features
- Log networks requests on iOS and Android
- View network requests made with in app viewer
- Debug network requests on release builds
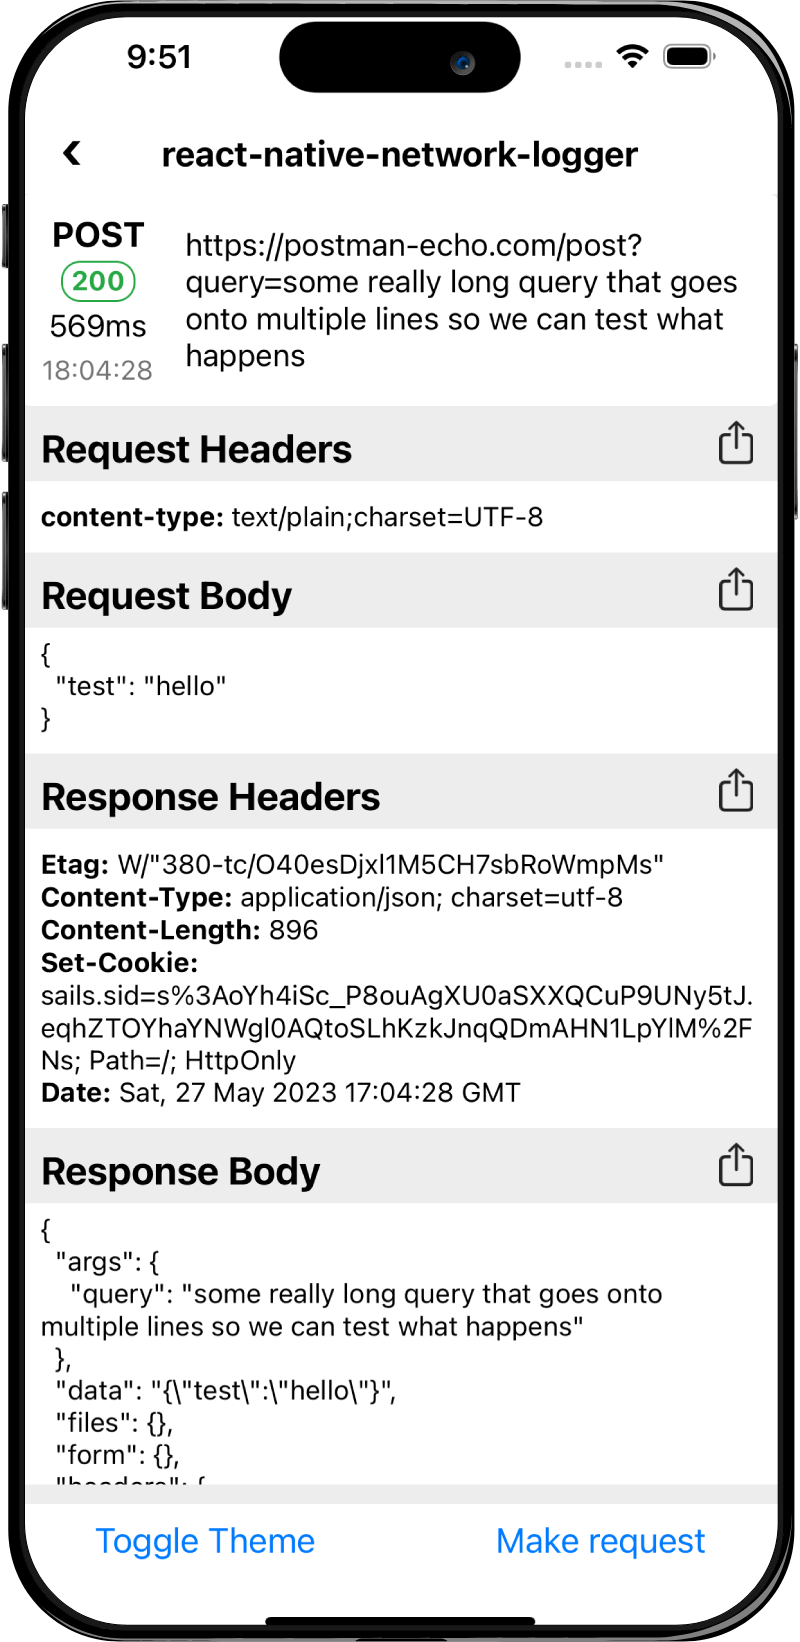
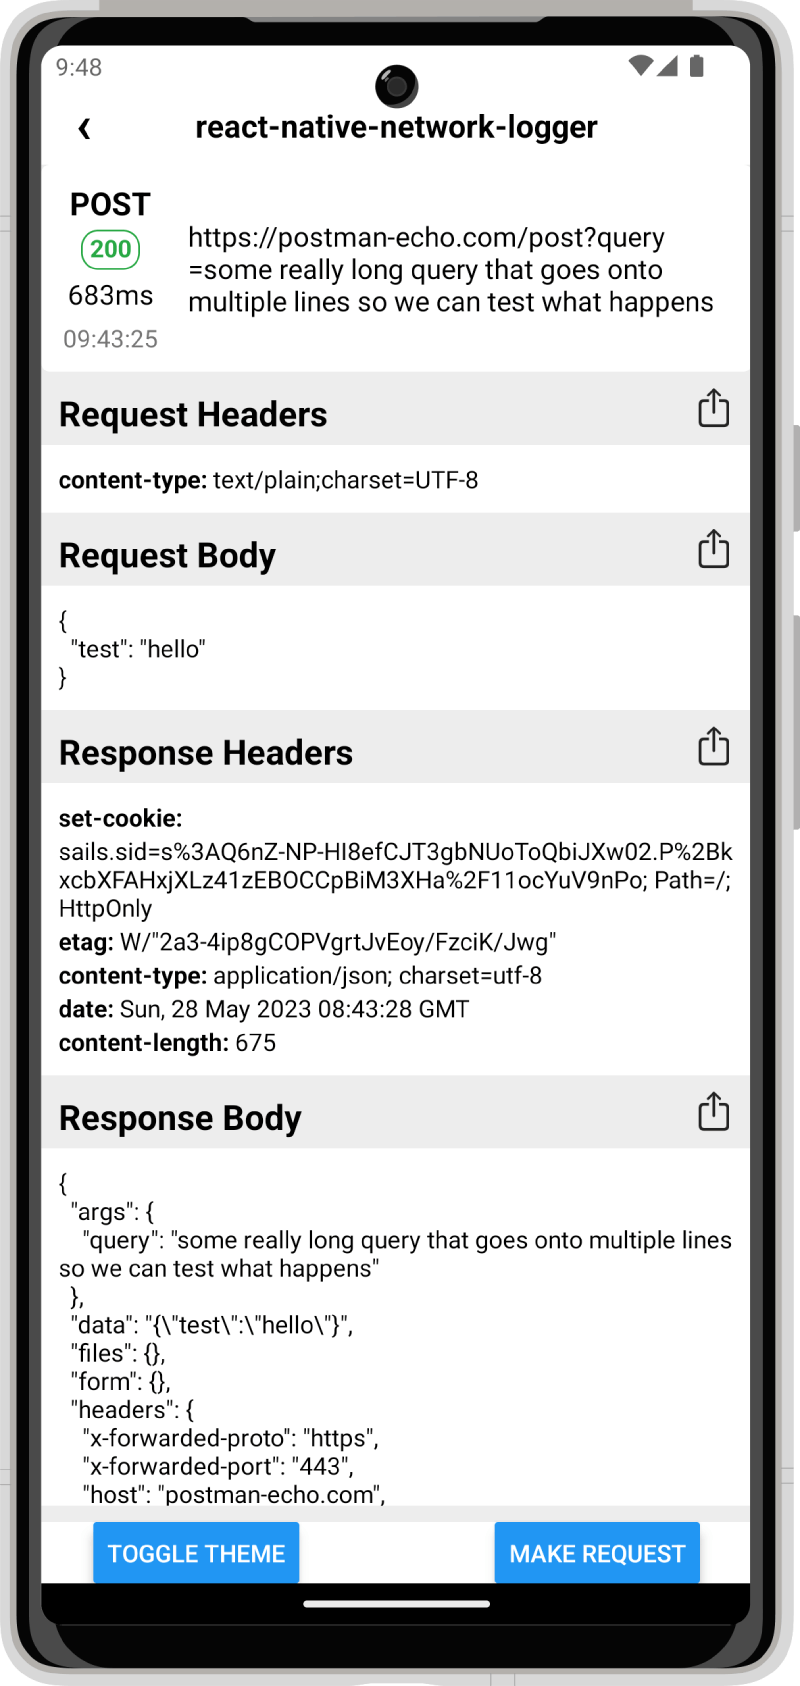
- Individually view request/response headers and body
- Copy or share headers, body or full request
- Share cURL representation of request
- Zero native or JavaScript dependencies
- Built in TypeScript definitions
- Extracts GraphQL operation name
- Export all logs in HAR format
Screenshots
iOS
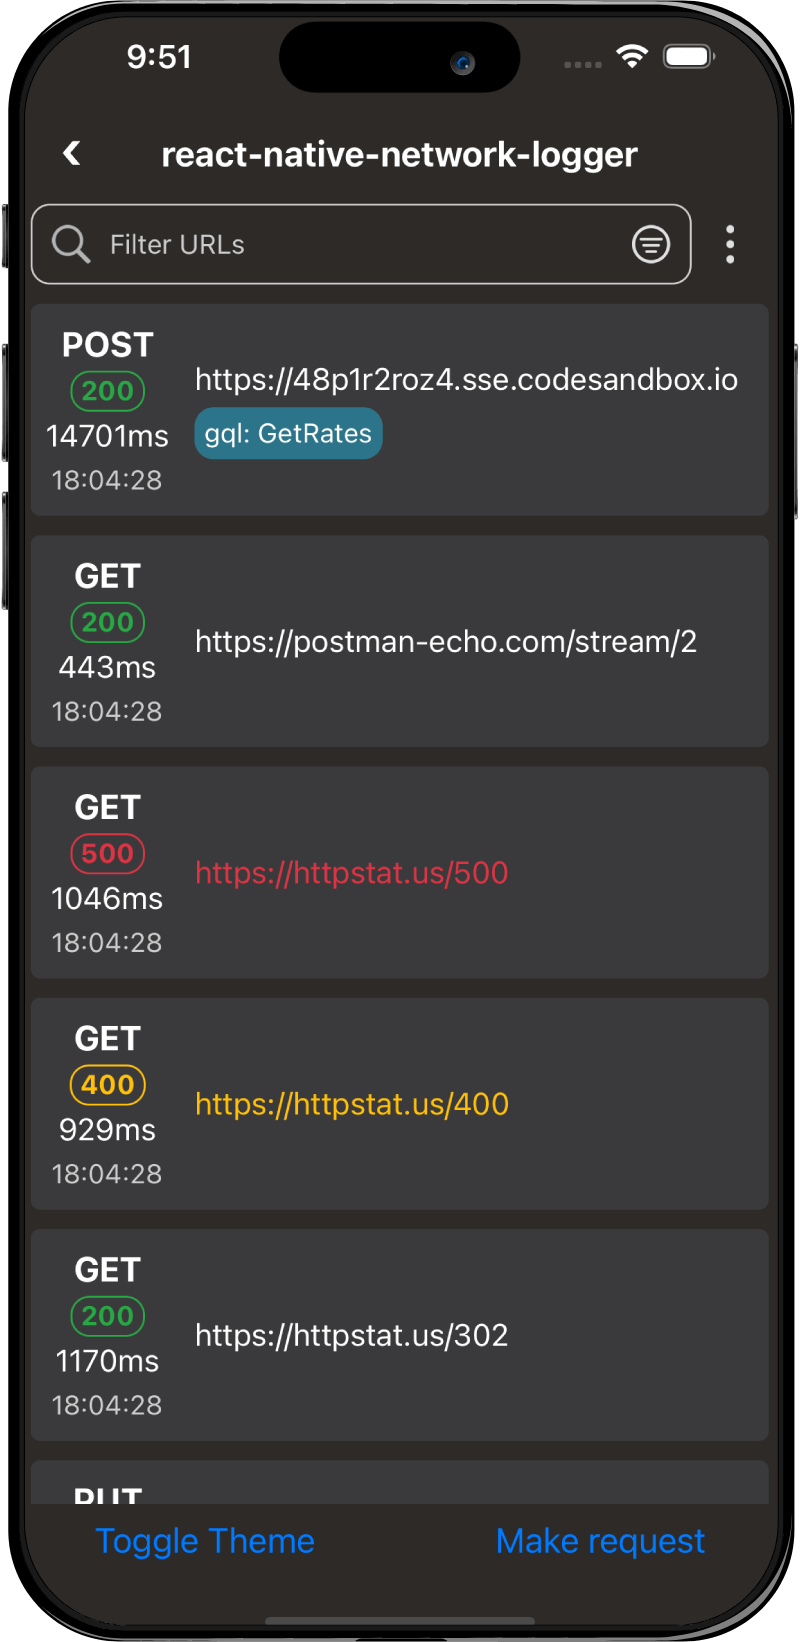
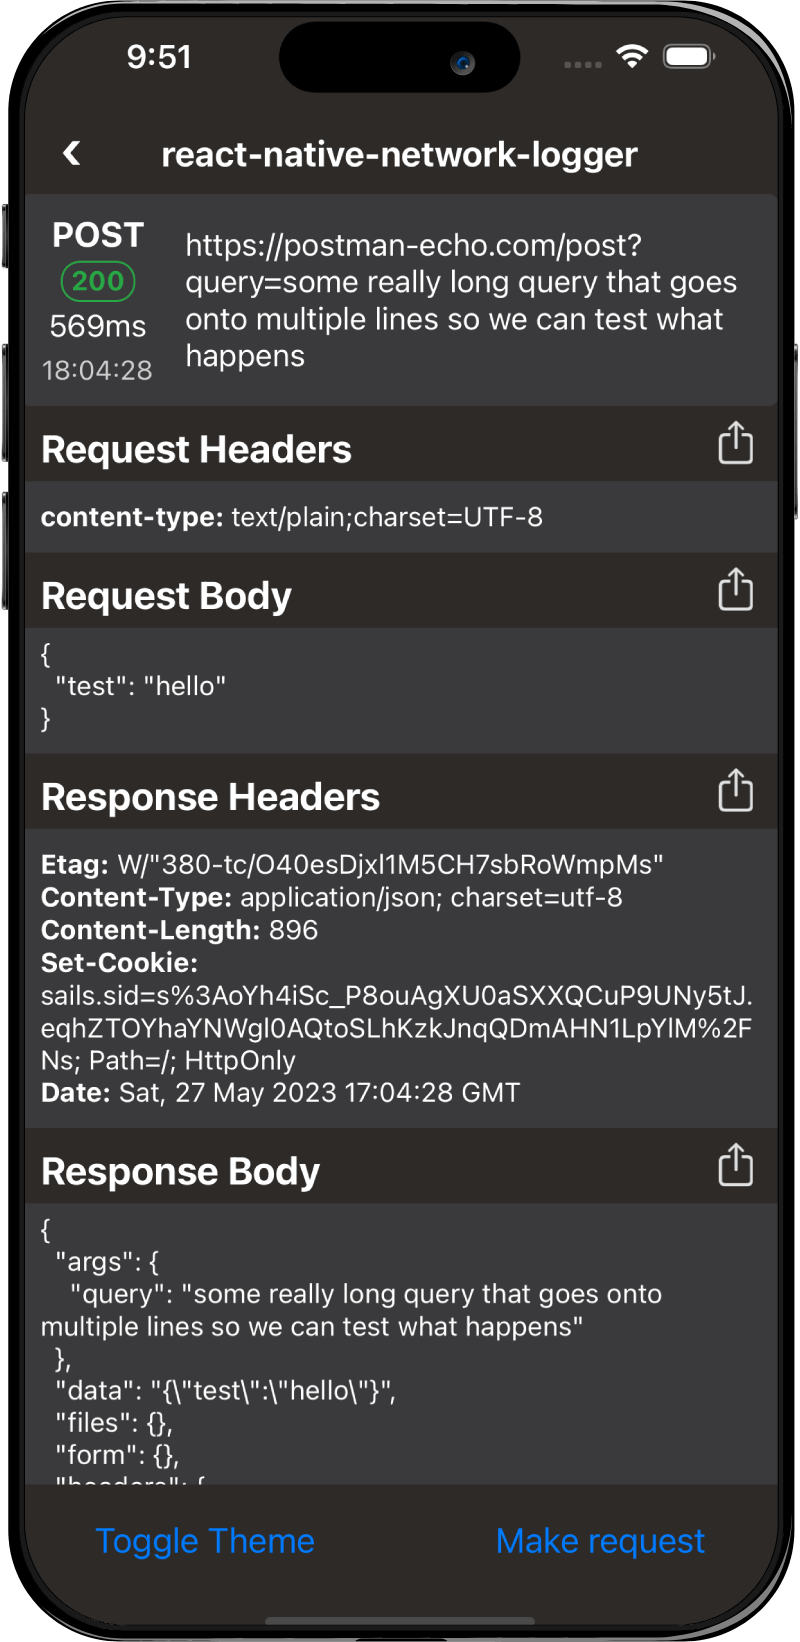
Android

Setup
Install
yarn add react-native-network-logger
or
npm install --save react-native-network-logger
Start Logging
Call startNetworkLogging in your apps entry point to log every request, or call it on a button press to manually trigger it.
import { startNetworkLogging } from 'react-native-network-logger';

startNetworkLogging();
AppRegistry.registerComponent('App', () => App);
Display Requests and Responses
import NetworkLogger from 'react-native-network-logger';

const MyScreen = () => <NetworkLogger />;
Themes
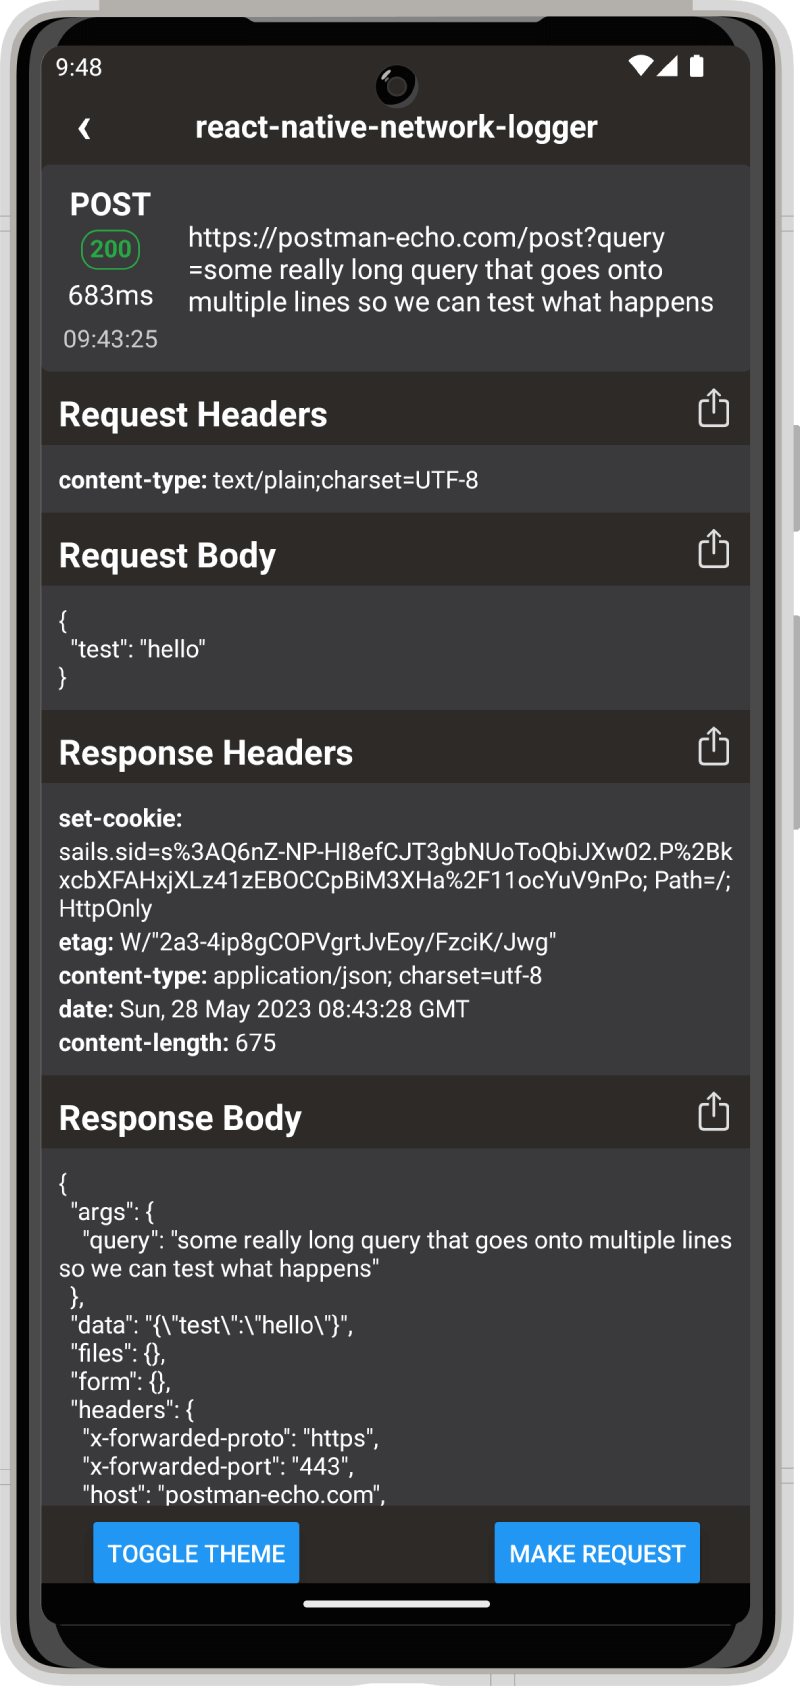
You can change between the dark and light theme by passing the theme prop with "dark" or "light".
import NetworkLogger from 'react-native-network-logger';

const MyScreen = () => <NetworkLogger theme="dark" />;
If preferred you can also override the theme entirely by passing in a theme object.
Note: breaking theme changes are not guaranteed to follow semver for updates
import NetworkLogger from 'react-native-network-logger';

const MyScreen = () => (
  <NetworkLogger
    theme={{
      colors: {
        background: 'red',
      },
    }}
  />
);
Logging options
Max Requests
You can configure the max number of requests stored on the device using by calling startNetworkLogging with the maxRequests option. The default is 500.
startNetworkLogging({ maxRequests: 500 });
Ignored Hosts
You can configure hosts that should be ignored by calling startNetworkLogging with the ignoredHosts option.
startNetworkLogging({ ignoredHosts: ['test.example.com'] });
Ignored Urls
You can configure urls that should be ignored by calling startNetworkLogging with the ignoredUrls option.
startNetworkLogging({ ignoredUrls: ['https://test.example.com/page'] });
Ignored Patterns
You can configure url patterns, including methods that should be ignored by calling startNetworkLogging with the ignoredPatterns option.
startNetworkLogging({
  ignoredPatterns: [/^GET http:\/\/test\.example\.com\/pages\/.*$/],
});
The pattern to match with is the method followed by the url, e.g. GET http://example.com/test so you can use the pattern to match anything, e.g. ignoring all HEAD requests.
startNetworkLogging({
  // Ignore all HEAD requests
  ignoredPatterns: [/^HEAD /],
});
Sorting
Set the sort order of requests. Options are asc or desc, default is desc (most recent at the top).
import NetworkLogger from 'react-native-network-logger';

const MyScreen = () => <NetworkLogger sort="asc" />;
Max Rows
Set the maximum number of rows to display in the list to improve rendering. Default is same as request limit.
import NetworkLogger from 'react-native-network-logger';

const MyScreen = () => <NetworkLogger maxRows={100} />;
Compact Rows
Make the rows smaller to fit more on the screen.
import NetworkLogger from 'react-native-network-logger';

const MyScreen = () => <NetworkLogger compact />;
Force Enable
If you are running another network logging interceptor, e.g. Reactotron, the logger will not start as only one can be run at once. You can override this behaviour and force the logger to start by using the forceEnable option.
startNetworkLogging({ forceEnable: true });
Integrate with existing navigation
Use your existing back button (e.g. in your navigation header) to navigate within the network logger.
import NetworkLogger, { getBackHandler } from 'react-native-network-logger';

const navigation = useNavigation();
const onBack = getBackHandler(navigation.goBack);

const MyScreen = () => (
  <Screen onBackPressed={onBack}>
    <NetworkLogger />
  </Screen>
);
Example App
To test the example app, after cloning the repo, install the required dependencies by running:
yarn bootstrap
Then start the example app by running:
yarn example start
You should then be able to open the expo server at http://localhost:3000/ and launch the app on iOS or Android.
For more setup and development details, see Contributing.
Why
Network requests can be debugged using tools such as React Native Debugger, however this requires both a debug build of the app and the debugger to be enabled. This library can be built with you app and usable by anyone using your app to see network issues and report them back to developers.
As the library is very small you can safely bundle it with the production version of your app and put it behind a flag, or have a separate testing build of the app which has the network logger enabled.
Contributing
Please read CONTRIBUTING.md for details on our code of conduct, and the process for submitting pull requests.
License
This project is licensed under the MIT License - see the LICENSE file for details.